Albedo is a term we are very familiar with in this class. It it a measure of the percentage light reflected off the surface of an object. We have used this term most frequently when describing the surfaces of worlds in your solar system. For example mare surfaces on the Moon appear dark, we refer to these as low albedo surfaces. In contrast the lunar highlands have a relative high albedo.
We have even linked the albedo of the lunar surfaces to specific samples. For example we have seen that the lunar mare are composed primarily of basalts. When viewed by the eye, these basalts look dark, they have a low albedo, therefor the mare surfaces have a low albedo.
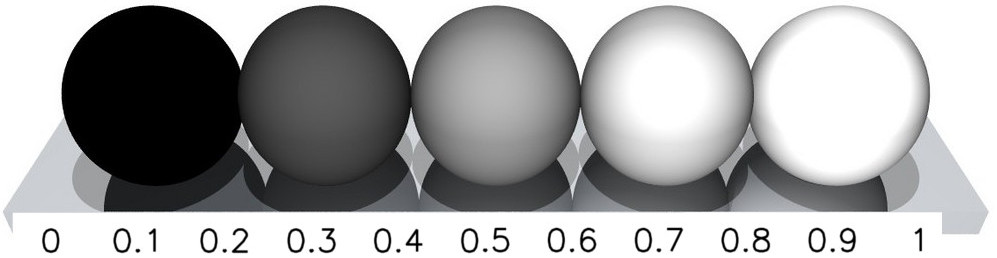
We have indicated albedo by a number ranging between 0.0 and 1.0. An albedo of 0.0 is very dark (no light reflected) and an albedo of 1.0 is very bright (all light reflected). Basalt has an albedo of about 0.11
When we look at a rock, we are viewing it over the whole of the visible part of the electromagnetic spectrum. The visible part of the spectrum is that part of the spectrum that the human eyes respond to.
We have all seen that when while light passes through a prism, it is separated into the various colors that make up the visible spectrum. Each of these colors correspond to a specific wavelength of light. In this class we measure the wavelength of light in nanometers (nm). One nm is equal to one billionth of a meter. The human eye is sensitive to light in the range of 380 to 750 nm. The image below shows the correspondence between color and wavelength.

We can be more specific when we measure albedo by also keeping track of the specific wavelength of light at which me measure the albedo. When we do this we can create a plot called a reflectance spectra. On the x-axis we plot the wavelength of light, on the y-axis we plot the albedo at that wavelength. We will almost always plot the x-axis with blue (short wavelengths) on the left and red (long wavelengths) on the right.
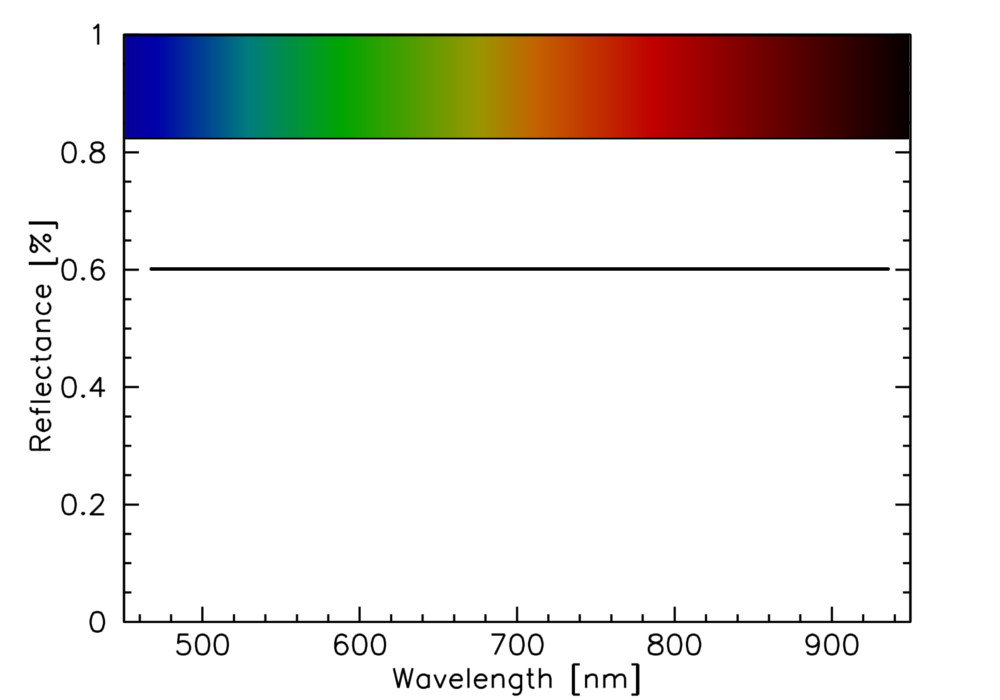
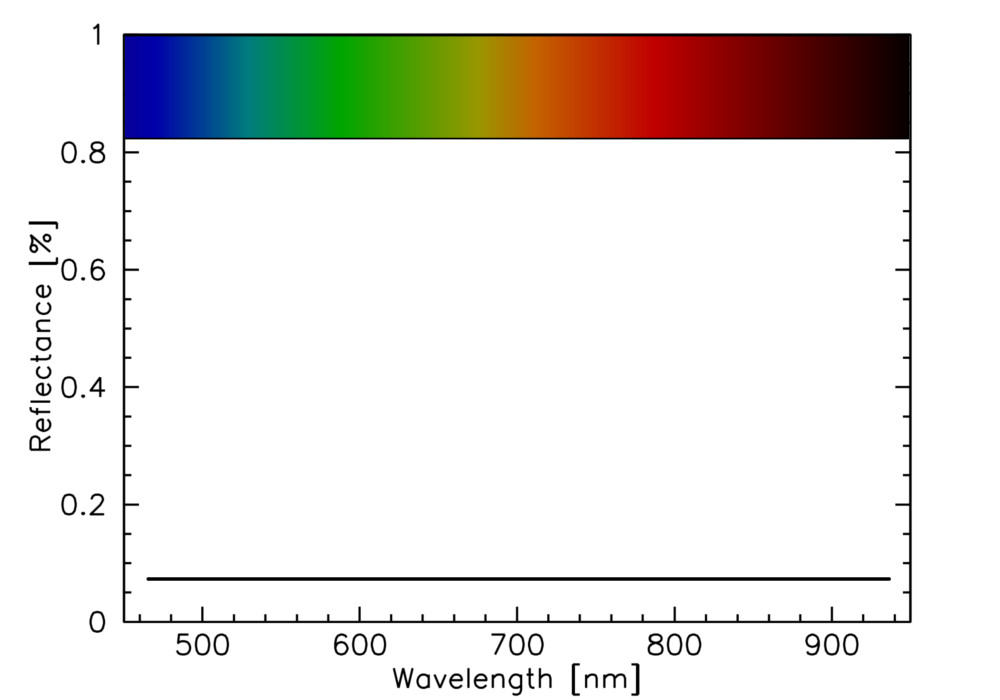
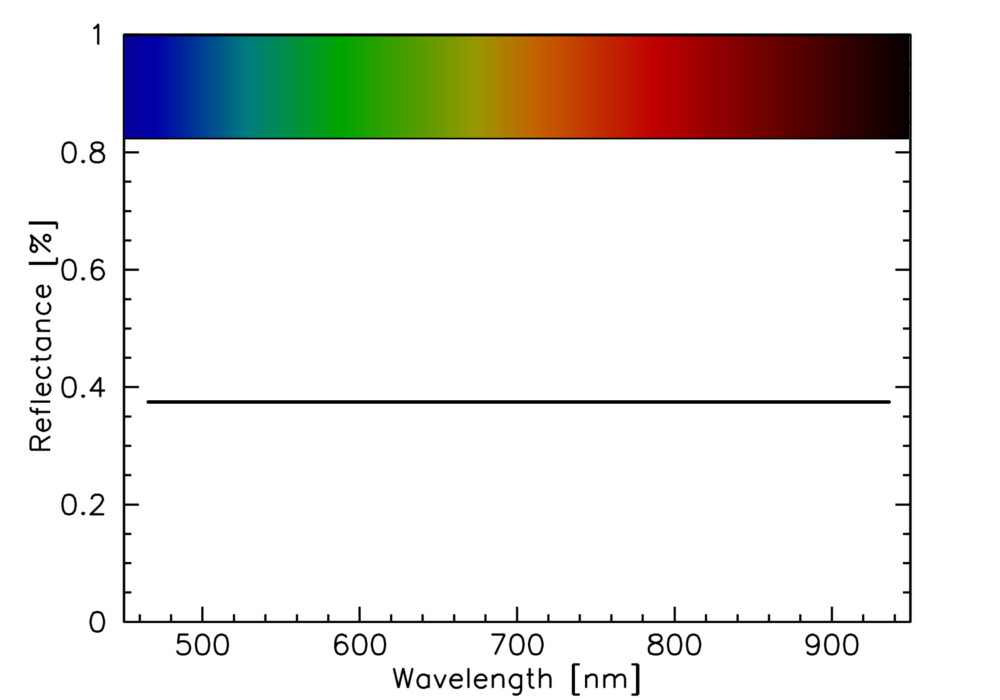
An example: Above are three spectra plots. The one on the right is a plot of the reflectance spectra of a sheet of white notebook paper. As you can see it reflects about 60% (0.6) of the light at all visible wavelengths. This is why it appears white. The middle plot if of a black piece of paper. It looks the same, only at a lower albedo 7% (0.07). Finally, on the right is a plot of the spectra of a grey piece of paper. The albedo of this, 38% (0.38) is in between to white and black paper. In general, any object the reflects light of all wavelengths equally is called a grey object.
As you can see the position of the spectra relative to the y-axis is a measure of the brightness of the object.
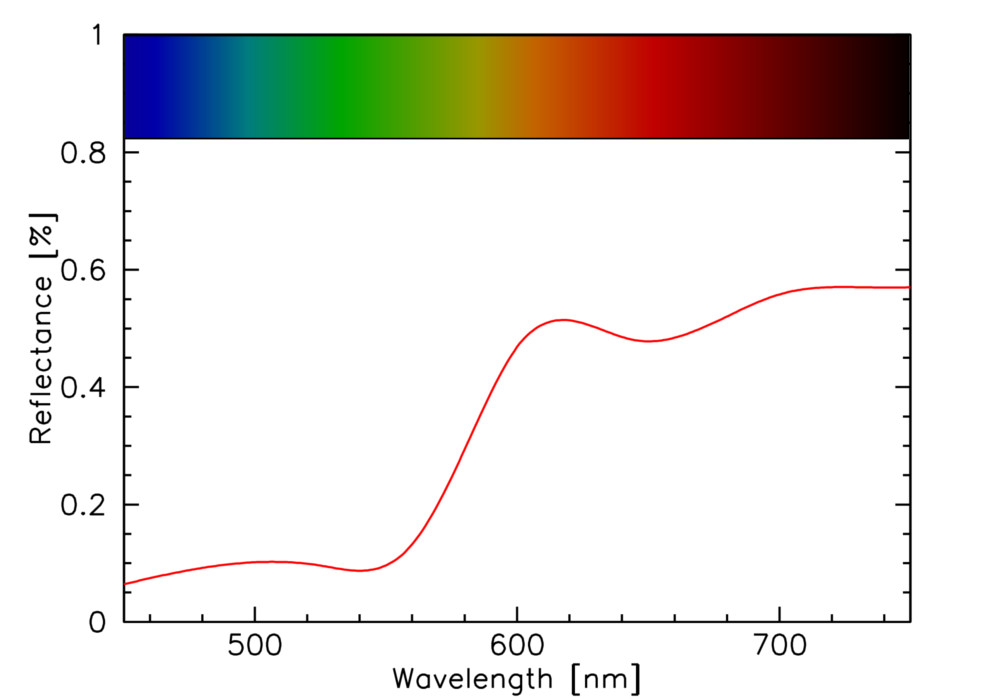
Of course not all objects are grey. When we say an object is a color what we are saying is that the object reflects more light in one part of the spectrum than the others. For example, the image on the left shows the spectra of a red ball. As you can see the spectra is higher (brighter) at the red part of the spectra. You can also see that the ball is fairly bright, the highest albedo is about 60% (0.6).
The position of the brightest part of the spectra relative to the x-axis is a measure of the color of the object.
A reflectance spectra of an object contains information about both the color and brightness of an object.
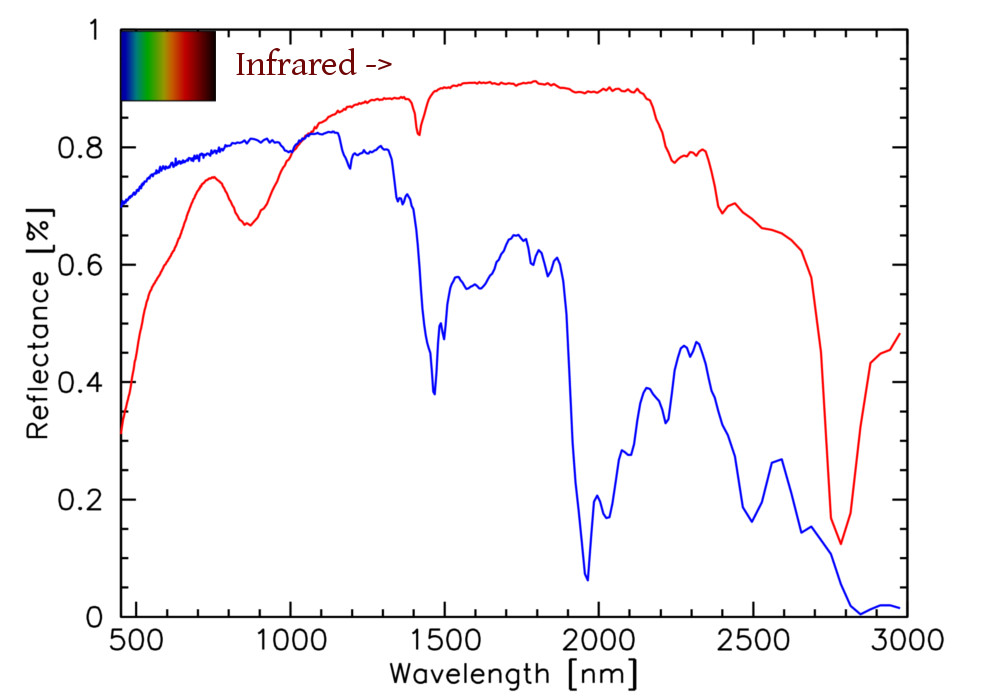
Visible light is only a small fraction of the entire electromagnetic spectrum. Everything we have seen above can be generalized to all wavelengths of light. For example, we can measure the albedo of a sample in the infrared part of the spectrum, as well as the visible part. As a matter of fact, most of the interesting parts of the spectrum for rocks are generally in the infrared part of the spectrum.
The spectra on the right shows the reflectance spectra of two rock samples. Notice that the visible part of the spectra is only a small part of the range that is plotted. You can see that lots of interesting things are happening outside the visible part of the spectrum.
Remember that you can not see outside of the visible part of the spectrum, so if I ask you about what something looks like, don't go drawing stuff out in the infrared or ultraviolet, you can not see out there.
Rocks are made up of a collection of minerals, and these minerals are made up of a specific collection and structure of elements (usually in a crystal structure). For example, the "Genesis Rock" we talk so much about that was brought back by Apollo 15 is a type of rock called an Anorthosite. This rock is composed primarily of mineral called plagioclase feldspar. This mineral has the chemical formula [CaAl2Si2O8] meaning that it is made up of the elements Calcium (Ca), Aluminum (Al), Silicon (Si), and Oxygen (O) all arranged in a specific crystal structure.
When light is reflected off a rock, the various crystals in the rocks absorb and reflect different wavelengths of light. The specific wavelengths of light they absorb and reflect depends on the composition and structure of the crystal. By looking at the reflectance spectrum of a rock we can get an idea of the minerals that make up the rock. This turns out to be a very powerful tool in planetary astronomy. It allows us to determine the composition of a rock by looking at the reflected light. We do not need the have a sample in hand. We do not even have to land on a surface - we can determine the composition of materials from orbit, or from telescopes on the Earth. This type of science-at-a-distance is called remote sensing.
While your standard camera will take images using the entire visible part of the spectrum, most astronomical instruments will image an object using only a small part of the wavelength range. Cutting out all but a small part of the wavelength range is the job of a filter. Images taken through filters can be very useful.
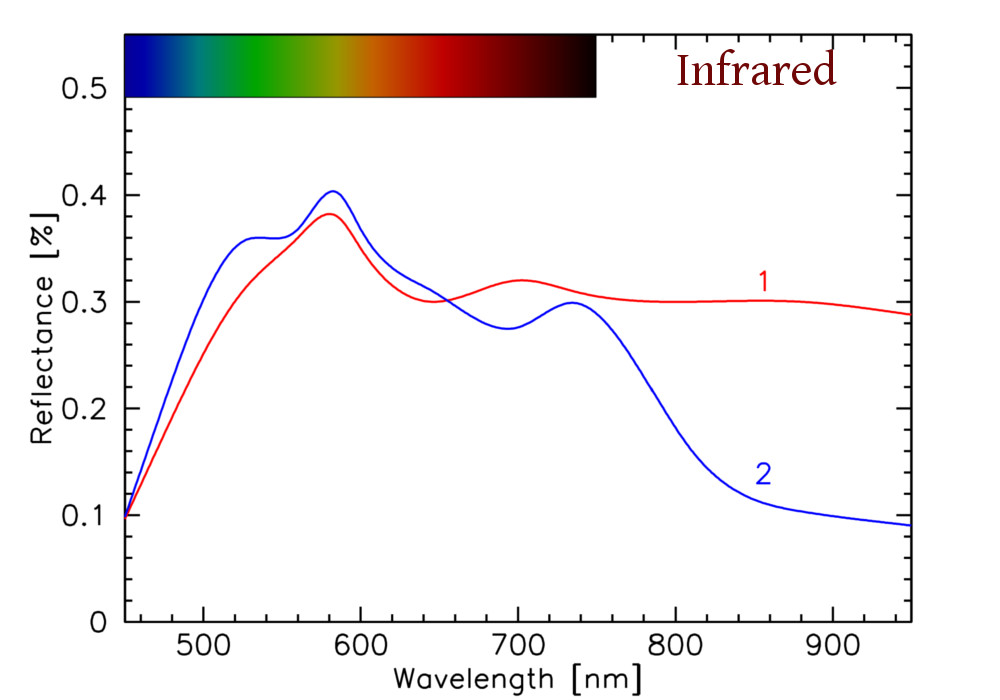
Look at the spectra on the left. Both objects have a very similar spectra in the visible. A regular camera image of the two objects would show them to have a very similar color.
However, the situation is changed if we look at the objects in the infrared. If you had a filter that only let through the infrared part of the spectrum (and a detector sensitive to the infrared), you could easily distinguish the two objects.
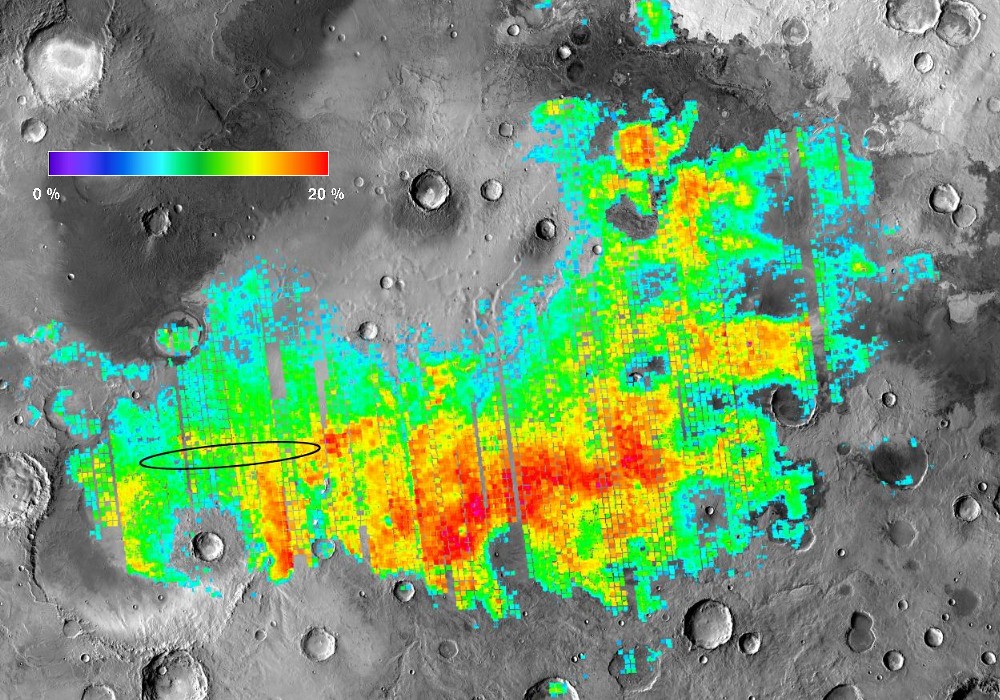
In this class we learned that the Mars Exploration Rover Opportunity landed at the site that was chosen because was know to be rich in the mineral hematite. How was this site know to have hematite if it had never been visited before? It was known through remote sensing.
A satellite in orbit around Mars called the Mars Global Surveyor carried an instrument called the Thermal Emission Spectrometer (TES) that took high resolution spectra of the surface of Mars in the infrared part of the spectrum, the part were rocks are interesting.
The image below-left shows the infrared spectra of the surface of Mars at the Opportunity landing site. The site is mostly composed of basalt (black spectra). The red spectra shows the data for hematite. You can see that it looks very similar to basalt, except around wavelengths of 2400 nm (shown at the red bar). At this wavelength, hematite is much less reflective than basalt. By looking only in this part of the spectra (using a filter) you can pick out the hematite rich regions from orbit. This is what the TES on the Mars Global Surveyor did, producing the map below-center. The hematite-rich region shows up right in the middle of the map. This is where Opportunity was sent (below-right).
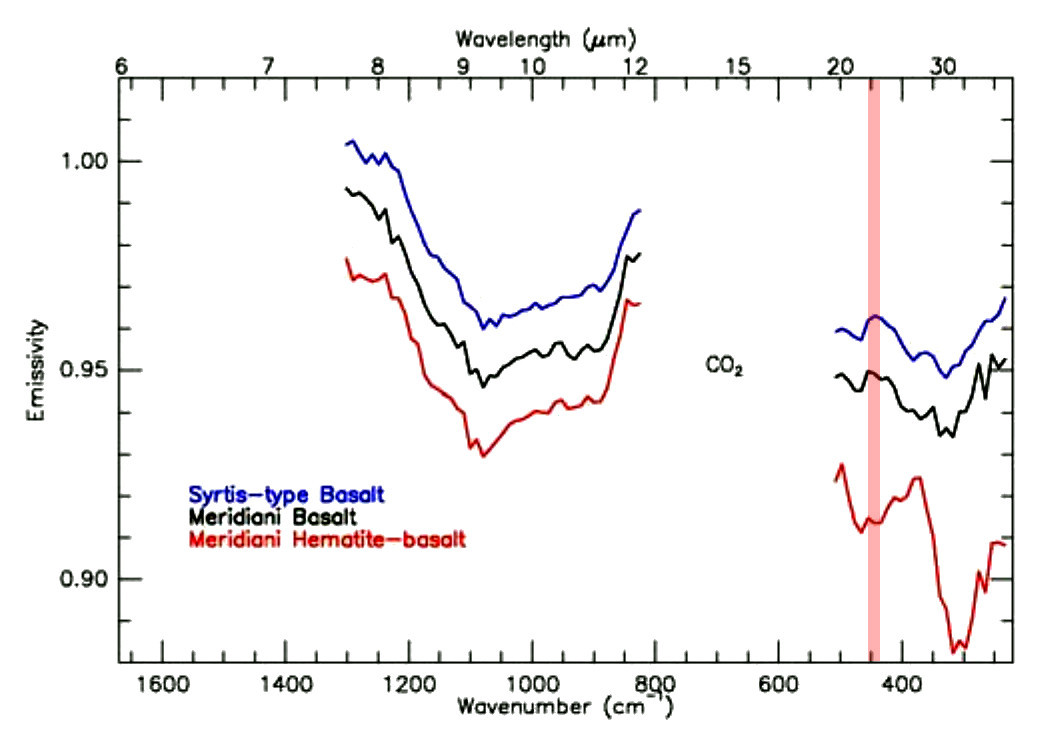
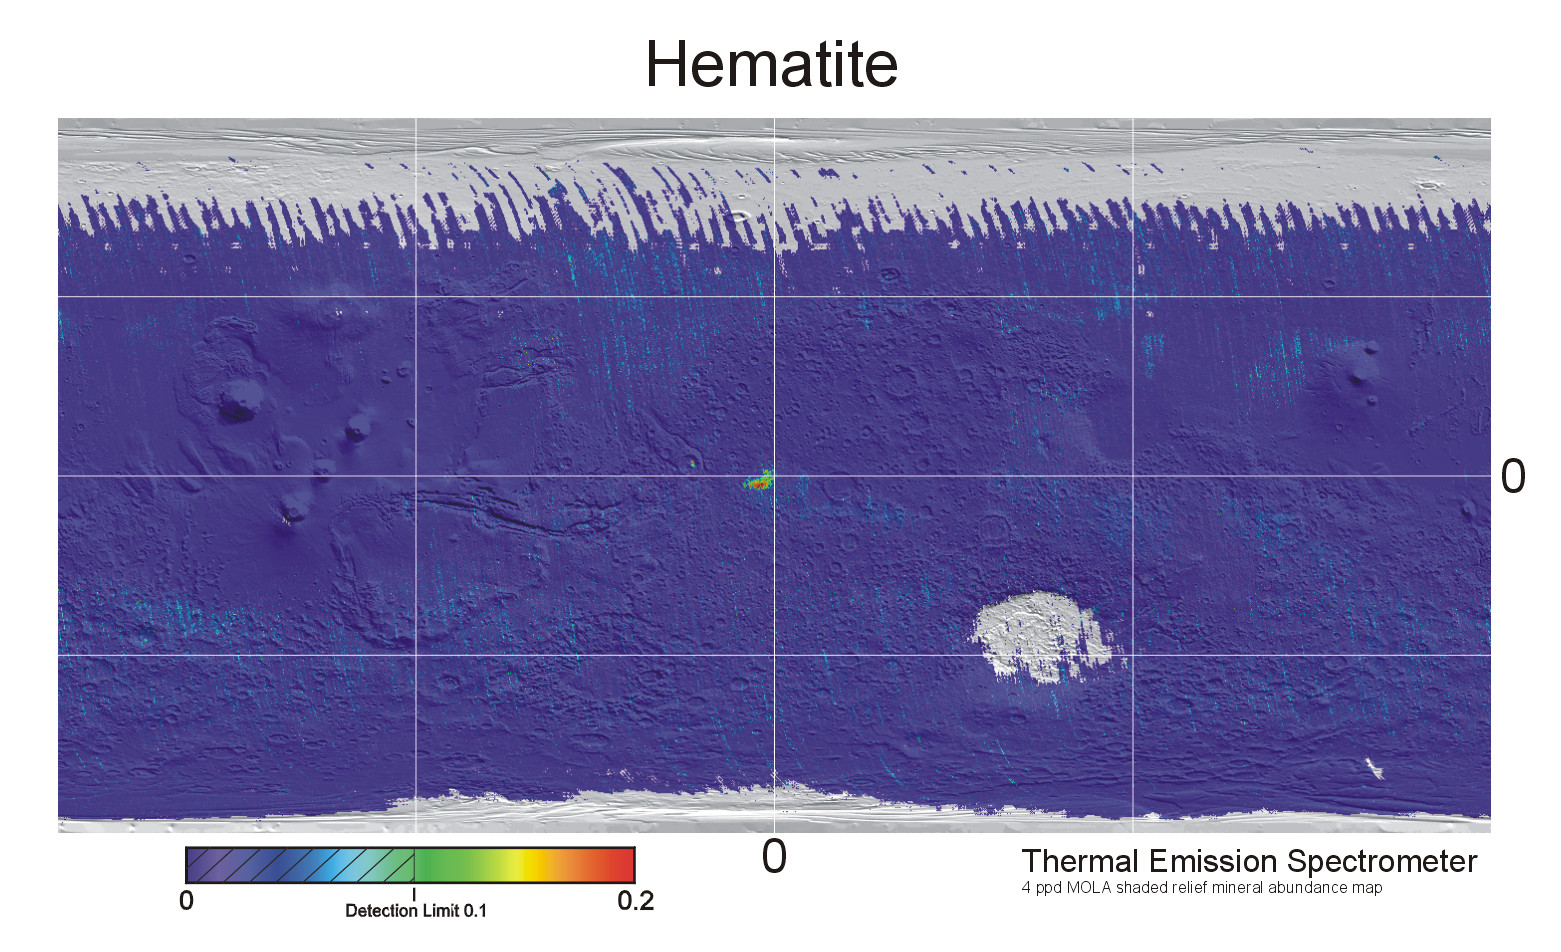
Of course you can do this for a wide variety of minerals, and indeed the TES did this producing very cool mineral maps of the surface of Mars.