This is a very simple math and graph tutorial for those of you who have not seen math in a while. It is by no means complete, but it hits the highlights of the concepts I use all of the time in class.
A little terminology: the number on the top of a fraction is called the numerator while the number on the bottom is called the denominator . For example, in the fraction 2/3, 2 is the numerator and 3 is the denominator. Of course in formulas, the numerators and denominators can be quite a bit more complicated. The reciprocal of a fraction is simply the fraction turned upside down. The reciprocal of 2/3 is 3/2.
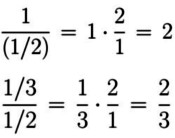
The place where people seems to have the most problems with fractions in this class is the case were the denominator is itself a fraction. Simplifying this type of problem is easy: just multiply the numerator by the reciprocal of the denominator.
In the first example on the right, the numerator is 1 and the denominator is 1/2. The reciprocal of the denominator (1/2) is equal to (2/1), so the problem simplifies to 1 times 2 which equals 2.
In the second example, both the numerator and the denominator are fractions, but the process is exactly the same. Make sure you can do simple examples like this in your sleep.
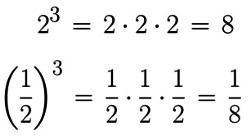
Powers, or exponents, occur a lot in this class. Particularly when we are talking about gravity. Exponents are simply the number of times an expression get multiplied by itself. This expression can be a formula, a variable, a number, a fraction, etc. For example on the right is an example of the exponentiation of a number and a fraction.
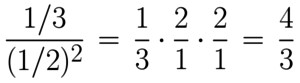
Now you can combine the fractions above with exponentiation to manipulate fraction taken to various powers. The example on the left shows an example of this. Make sure you understand this example, as you will be asked to do something very similar to it on the midterm.
A special case of exponents that occurs all of the time in this class with when the number 10 is taken to various powers. This is used when numbers get so large that writing out all of the zeros becomes a pain. For example the expression 106 is just 10 multiplied by itself 6 times. This expression is equal to million (1,000,000) and is much easier to write than all of the zeros. In this class we will use the number a billion (109) a lot. Writing 109 is much easier than 1,000,000,000 and saves you from having to count all of the zeroes to see that the number is actually a billion.
Taking 10 to various powers leads naturally to the discussion of scientific notation. Scientific notation is simply a shorthand way of expressing very large numbers. And since there are lots of very large numbers in this class, there will be lots of scientific notation. An example of scientific notation if given below. See how using powers of 10, make the large number much easier to write and read.

N.B. In very rare cases in this class scientific notation will be notated with an "e" instead of a power of 10. For example the number 1.63 * 106 may be written as 1.63e6.
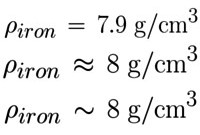
Finally, a few words on a few of the mathematical symbols you will see often in this class. On the right are three expression for the value of the density of Iron. The first expression is the exact equality (=). It should be read: "The density of Iron is equal to 7.9 g/cm3." The other two expression are what I use for approximate values. Both of these expression should be read: "The density if Iron is approximately equal to 8 g/cm3." The last symbol (~) is not really the correct expression for "approximately equal to" but I use it as such, so there.
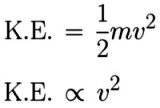
On the left are two expression for the kinetic energy of an object. The first expression is the exact equality. It should be read: "The kinetic energy (K.E.) is equal to the mass (m) times the velocity (v) squared. In the second expression, the symbol that looks like the Greek letter alpha is the symbol for "proportional to". This expression should be read: "The kinetic energy (K.E.) is proportional to the velocity (v) squared. I use this when I am pointing out some important aspect of a formula. For example, that the kinetic energy depends strongly on the velocity of an object.
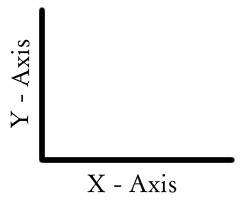
A graph is a chart or drawing that shows the relationship between changing things. They are a diagram displaying the relationship between numbers or amounts. Common graphs use bars, lines, points or parts of a circle to display data. Nearly all of the graphs I use in this class are the classic 2-dimensional X-Y plots. I will almost always refer to the horizontal axis as the X-axis and the vertical axis as the Y-axis (see plot on right).
The axes actually have proper names; the ordinate for the X-axis and the abscissa for the Y-axis. However, I never remember those names so I will not use them.
The two main axes types I use in this class are linear and logarithmic . Often times I will not mention the types of axes displayed, so pay attention.
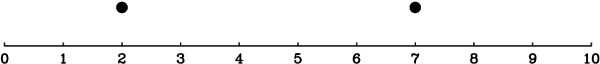
A linear graph has values that change as you would expect. In the example below one point 5 units farther down the X-axis has a value that is 5 units larger.
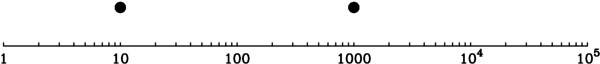
A logarithmic graph is more complicated. Generally, the major division on the graph differ by a power of 10. For example on the X-axis below the two points are two major divisions away, but their values differ by a factor of 100 = (102).
N.B. Many graphs have one axis linear and the other logarithmic. These types of graphs are often referred to as semi-logarithmic.